AME DMA


As of date:4/23/2024
AME stock price:179.85
AME 50 DMA:179.36
AME 200 DMA:161.44
AME MACD (200-50):-17.92

Also see:
AME Market Cap History
AME Shares Outstanding History
AME YTD Return
AME RSI
AME MACD
AME Technical Analysis

Coastal Financial Breaks Above 200-Day Moving Average - Bullish for CCB
1 hour, 18 minutes ago


CNOB Makes Bullish Cross Above Critical Moving Average
1 hour, 19 minutes ago


Bullish Two Hundred Day Moving Average Cross - MDLZ
1 hour, 21 minutes ago


ATXS Makes Notable Cross Below Critical Moving Average
1 hour, 22 minutes ago


United States Steel Breaks Below 200-Day Moving Average - Notable for X
1 hour, 26 minutes ago


Boyd Group Services Crosses Below Key Moving Average Level
2 hours, 9 minutes ago


Notable Two Hundred Day Moving Average Cross - BVS
5 hours, 45 minutes ago


LOVE Crosses Above Key Moving Average Level
5 hours, 45 minutes ago


AUTL Makes Notable Cross Below Critical Moving Average
5 hours, 45 minutes ago


BILI Crosses Above Key Moving Average Level
5 hours, 46 minutes ago


KalVista Pharmaceuticals Breaks Below 200-Day Moving Average - Notable for KALV
5 hours, 46 minutes ago


OCUL Makes Notable Cross Below Critical Moving Average
5 hours, 46 minutes ago


United Community Banks Breaks Above 200-Day Moving Average - Bullish for UCBI
5 hours, 50 minutes ago


FMNB Makes Bullish Cross Above Critical Moving Average
5 hours, 51 minutes ago


Notable Two Hundred Day Moving Average Cross - MANH
6 hours, 28 minutes ago


More Technical Analysis News

AME DMAAME MACD
AMETEK is a global manufacturer of electronic instruments and electromechanical devices with operations in North America, Europe, Asia and South America. Co.'s products are marketed and sold worldwide through the following operating groups: Electronic Instruments (EIG) and Electromechanical (EMG). EIG is engaged in the design and manufacture of analytical, test and measurement instruments for the process, aerospace, medical, research, power and industrial markets. EMG is a supplier of automation solutions, thermal management systems, specialty metals and electrical interconnects.

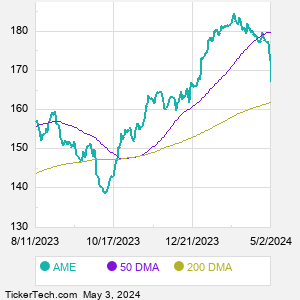
When researching a stock like AMETEK, many investors are the most familiar with Fundamental Analysis — looking at a company's balance sheet, earnings, revenues, and what's happening in that company's underlying business. Investors who use Fundamental Analysis to identify good stocks to buy or sell can also benefit from AME Technical Analysis to help find a good entry or exit point. Technical Analysis is blind to the fundamentals and looks only at the trading data for AME stock — the real life supply and demand for the stock over time — and examines that data in different ways. One of those ways is to calculate a Simpe Moving Average ("SMA") by looking back a certain number of days. One of the most popular "longer look-backs" is the AME 200 day moving average ("AME 200 DMA"), while one of the most popular "shorter look-backs" is the AME 50 day moving average ("AME 50 DMA"). A chart showing both of these popular moving averages is shown on this page for AMETEK.
10 Most Oversold S&P 500 Stocks
10 Most Overbought S&P 500 Stocks

10 ETFs With Stocks Insiders Are Buying
10 ETFs With Most Upside To Targets
The DividendRank Top 25
Warren Buffett Dividend Stocks
10 Cheap Dividend Stocks Under $10
10 Top DividendRank'ed Energy Stocks
The 10 Highest Yielding Preferred Stocks
The 15 Most Active S&P Call & Put Options
Quotes delayed 20 minutes

Email EnvelopeFree AME Email Alerts:
Get Dividend Alerts
Get SEC Filing Alerts
Video: Technical Analysis


If the video does not load after a few moments, Upgrade to the Latest Flash Player.
AMETEK (AME) is categorized under the Industrials sector; to help you further research DMA, below are some other companies in the same sector:

APH DMA
AXON DMA
BA DMA
CAT DMA
CHRW DMA
CPAY DMA
CPRT DMA
CSGP DMA
CSX DMA
CTAS DMA
More Industrials companies »


AME DMA | www.StockDMA.com | Copyright © 2019 - 2024, All Rights Reserved

Nothing in StockDMA.com is intended to be investment advice, nor does it represent the opinion of, counsel from, or recommendations by BNK Invest Inc. or any of its affiliates, subsidiaries or partners. None of the information contained herein constitutes a recommendation that any particular security, portfolio, transaction, or investment strategy is suitable for any specific person. All viewers agree that under no circumstances will BNK Invest, Inc,. its subsidiaries, partners, officers, employees, affiliates, or agents be held liable for any loss or damage caused by your reliance on information obtained. By visiting, using or viewing this site, you agree to the following Full Disclaimer & Terms of Use and Privacy Policy. Video widget and market videos powered by Market News Video. Quote and option data delayed at least 15 minutes; stock quote data powered by Ticker Technologies, and Mergent.
X
Wait! Don't leave yet.
Want to receive our latest research absolutely free?


Click the button below for your complimentary copy of Your Early Retirement Portfolio: Dividends Up to 8.7%—Every Month—Forever.

You'll discover the details on 4 stocks and funds that pay you massive dividends as high as 8.7%.