Cisco Systems designs and sells technologies that power the Internet. Co.'s products and technologies include: Secure, Agile Networks, which consists of networking technologies of switching, enterprise routing, wireless, and compute products; Internet for the Future, which consists of routed optical networking, 5G, silicon and optics solutions; Collaboration, which consists of Meetings, Collaboration Devices, Calling, Contact Center and Communication Platform as a Service offerings; End-to-End Security, which consists of its Cloud and Application Security, Industrial Security, Network Security, and User and Device Security offerings; Optimized Application Experiences; and Other Products.
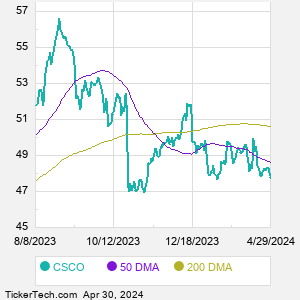
When researching a stock like Cisco Systems, many investors are the most familiar with Fundamental Analysis — looking at a company's balance sheet, earnings, revenues, and what's happening in that company's underlying business. Investors who use Fundamental Analysis to identify good stocks to buy or sell can also benefit from CSCO Technical Analysis to help find a good entry or exit point. Technical Analysis is blind to the fundamentals and looks only at the trading data for CSCO stock — the real life supply and demand for the stock over time — and examines that data in different ways. One of those ways is to calculate a Simpe Moving Average ("SMA") by looking back a certain number of days. One of the most popular "longer look-backs" is the CSCO 200 day moving average ("CSCO 200 DMA"), while one of the most popular "shorter look-backs" is the CSCO 50 day moving average ("CSCO 50 DMA"). A chart showing both of these popular moving averages is shown on this page for Cisco Systems. |