CTAS DMA


As of date:4/23/2024
CTAS stock price:666.33
CTAS 50 DMA:643.58
CTAS 200 DMA:559.00
CTAS MACD (200-50):-84.58

Also see:
CTAS Market Cap History
CTAS Shares Outstanding History
CTAS YTD Return
CTAS RSI
CTAS MACD
CTAS Technical Analysis

Confluent Breaks Above 200-Day Moving Average - Bullish for CFLT
17 hours, 6 minutes ago


OLLI Makes Bullish Cross Above Critical Moving Average
17 hours, 26 minutes ago


Bullish Two Hundred Day Moving Average Cross - AY
17 hours, 27 minutes ago


Calamos Convertible and High Income Fund (CHY) Shares Cross Above 200 DMA
17 hours, 32 minutes ago


SYBT Crosses Above Key Moving Average Level
17 hours, 40 minutes ago


Apollo Commercial Real Estate Finance (ARI) Shares Cross Above 200 DMA
17 hours, 43 minutes ago


BlackRock Utility and Infrastructure Trust Breaks Above 200-Day Moving Average - Bullish for BUI
17 hours, 45 minutes ago


Bullish Two Hundred Day Moving Average Cross - UVV
17 hours, 48 minutes ago


ESE Makes Bullish Cross Above Critical Moving Average
17 hours, 48 minutes ago


Bullish Two Hundred Day Moving Average Cross - PHG
17 hours, 48 minutes ago


Haemonetics (HAE) Shares Cross Above 200 DMA
17 hours, 48 minutes ago


Bullish Two Hundred Day Moving Average Cross - SGY.CA
17 hours, 48 minutes ago


Cineplex Breaks Above 200-Day Moving Average - Bullish for CGX.CA
17 hours, 48 minutes ago


Bullish Two Hundred Day Moving Average Cross - PHVS
20 hours, 36 minutes ago


Bullish Two Hundred Day Moving Average Cross - BLTE
20 hours, 37 minutes ago


More Technical Analysis News

CTAS DMACTAS MACD
Cintas is a provider of corporate identity uniforms through rental and sales programs, as well as a provider of related business services, including entrance mats, restroom cleaning services and supplies, first aid and safety services and fire protection products and services. Co.'s reportable operating segments are the Uniform Rental and Facility Services, which consists of the rental and servicing of uniforms and other garments, including flame resistant clothing, mats, mops and shop towels and other ancillary items; and the First Aid and Safety Services, which consists of first aid and safety products and services.

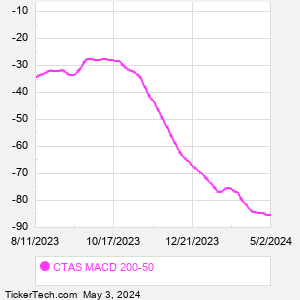
When researching a stock like Cintas, many investors are the most familiar with Fundamental Analysis — looking at a company's balance sheet, earnings, revenues, and what's happening in that company's underlying business. Investors who use Fundamental Analysis to identify good stocks to buy or sell can also benefit from CTAS Technical Analysis to help find a good entry or exit point. Technical Analysis is blind to the fundamentals and looks only at the trading data for CTAS stock — the real life supply and demand for the stock over time — and examines that data in different ways. One of those ways is to calculate a Simpe Moving Average ("SMA") by looking back a certain number of days. One of the most popular "longer look-backs" is the CTAS 200 day moving average ("CTAS 200 DMA"), while one of the most popular "shorter look-backs" is the CTAS 50 day moving average ("CTAS 50 DMA"). A chart showing both of these popular moving averages is shown on this page for Cintas.
10 Most Oversold S&P 500 Stocks
10 Most Overbought S&P 500 Stocks

10 ETFs With Stocks Insiders Are Buying
10 ETFs With Most Upside To Targets
The DividendRank Top 25
Warren Buffett Dividend Stocks
10 Cheap Dividend Stocks Under $10
10 Top DividendRank'ed Energy Stocks
The 10 Highest Yielding Preferred Stocks
The 15 Most Active S&P Call & Put Options
Quotes delayed 20 minutes

Email EnvelopeFree CTAS Email Alerts:
Get Dividend Alerts
Get SEC Filing Alerts
Video: Technical Analysis


If the video does not load after a few moments, Upgrade to the Latest Flash Player.
Cintas (CTAS) is categorized under the Industrials sector; to help you further research DMA, below are some other companies in the same sector:

DAL DMA
DE DMA
DOV DMA
EBAY DMA
EFX DMA
EMR DMA
ETN DMA
EXPD DMA
FDX DMA
FICO DMA
More Industrials companies »


CTAS DMA | www.StockDMA.com | Copyright © 2019 - 2024, All Rights Reserved

Nothing in StockDMA.com is intended to be investment advice, nor does it represent the opinion of, counsel from, or recommendations by BNK Invest Inc. or any of its affiliates, subsidiaries or partners. None of the information contained herein constitutes a recommendation that any particular security, portfolio, transaction, or investment strategy is suitable for any specific person. All viewers agree that under no circumstances will BNK Invest, Inc,. its subsidiaries, partners, officers, employees, affiliates, or agents be held liable for any loss or damage caused by your reliance on information obtained. By visiting, using or viewing this site, you agree to the following Full Disclaimer & Terms of Use and Privacy Policy. Video widget and market videos powered by Market News Video. Quote and option data delayed at least 15 minutes; stock quote data powered by Ticker Technologies, and Mergent.
X
Wait! Don't leave yet.
Want to receive our latest research absolutely free?


Click the button below for your complimentary copy of Your Early Retirement Portfolio: Dividends Up to 8.7%—Every Month—Forever.

You'll discover the details on 4 stocks and funds that pay you massive dividends as high as 8.7%.