Electronic Arts develops, markets, publishes and delivers games, content and services that can be experienced on game consoles, PCs, mobile phones and tablets. Co.'s portfolio includes brands that Co. either wholly owns (such as Apex Legends, Battlefield, and The Sims) or licenses from others (such as Madden NFL, Star Wars, and the 300+ licenses within Co.'s global football ecosystem). Co. develops and publishes games and services across diverse genres, such as sports, racing, first-person shooter, action, role-playing and simulation. Co. also provides its EA Play subscription service on consoles and PC. Co.'s packaged goods games are sold to market retailers.
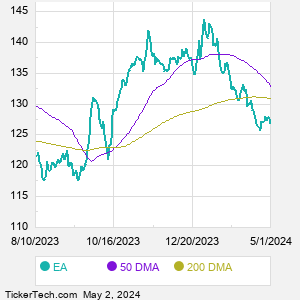
When researching a stock like Electronic Arts, many investors are the most familiar with Fundamental Analysis — looking at a company's balance sheet, earnings, revenues, and what's happening in that company's underlying business. Investors who use Fundamental Analysis to identify good stocks to buy or sell can also benefit from EA Technical Analysis to help find a good entry or exit point. Technical Analysis is blind to the fundamentals and looks only at the trading data for EA stock — the real life supply and demand for the stock over time — and examines that data in different ways. One of those ways is to calculate a Simpe Moving Average ("SMA") by looking back a certain number of days. One of the most popular "longer look-backs" is the EA 200 day moving average ("EA 200 DMA"), while one of the most popular "shorter look-backs" is the EA 50 day moving average ("EA 50 DMA"). A chart showing both of these popular moving averages is shown on this page for Electronic Arts. |