eBay DMA


As of date:6/11/2025
EBAY stock price:77.88
EBAY 50 DMA:69.38
EBAY 200 DMA:65.16
EBAY MACD (200-50):-4.22

Also see:
EBAY Market Cap History
EBAY Shares Outstanding History
EBAY YTD Return
EBAY RSI
EBAY MACD
EBAY Technical Analysis

Mission Produce Breaks Above 200-Day Moving Average - Bullish for AVO
58 minutes ago


LEGN Crosses Above Key Moving Average Level
58 minutes ago


SIGA Technologies Breaks Above 200-Day Moving Average - Bullish for SIGA
1 hour, 15 minutes ago


Notable Two Hundred Day Moving Average Cross - FISI
1 hour, 15 minutes ago


ASUR Crosses Below Key Moving Average Level
1 hour, 20 minutes ago


NWE Crosses Critical Technical Indicator
1 hour, 22 minutes ago


Mueller Water Products Breaks Below 200-Day Moving Average - Notable for MWA
1 hour, 30 minutes ago


IBDY Makes Bullish Cross Above Critical Moving Average
1 hour, 32 minutes ago


First Trust Intermediate Duration Investment Grade Corporate Breaks Above 200-Day Moving Average - Bullish for FIIG
1 hour, 32 minutes ago


GameStop Breaks Below 200-Day Moving Average - Notable for GME
1 hour, 33 minutes ago


Notable Two Hundred Day Moving Average Cross - TLK
1 hour, 41 minutes ago


CFR Crosses Below Key Moving Average Level
1 hour, 41 minutes ago


BP Makes Bullish Cross Above Critical Moving Average
1 hour, 49 minutes ago


NUMV Shares Cross Below 200 DMA
1 hour, 49 minutes ago


iShares Morningstar Small-Cap Growth Breaks Below 200-Day Moving Average - Notable for ISCG
1 hour, 52 minutes ago


More Technical Analysis News

EBAY DMAEBAY MACD
eBay Inc. is a global commerce company, through its Marketplace platforms, which connects buyer and seller in more than 190 markets around the world. Co.'s products include Promoted Listings Standard, Promoted Listings Express, Promoted Listings Advanced and External Promoted Listings. It has developed user interfaces, buyer, seller and developer tools and transaction processing, database and network applications that help enable its users to reliably and securely complete transactions on its sites.

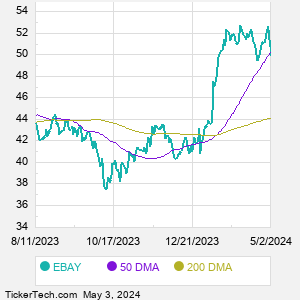
When researching a stock like eBay, many investors are the most familiar with Fundamental Analysis — looking at a company's balance sheet, earnings, revenues, and what's happening in that company's underlying business. Investors who use Fundamental Analysis to identify good stocks to buy or sell can also benefit from EBAY Technical Analysis to help find a good entry or exit point. Technical Analysis is blind to the fundamentals and looks only at the trading data for EBAY stock — the real life supply and demand for the stock over time — and examines that data in different ways. One of those ways is to calculate a Simpe Moving Average ("SMA") by looking back a certain number of days. One of the most popular "longer look-backs" is the EBAY 200 day moving average ("EBAY 200 DMA"), while one of the most popular "shorter look-backs" is the EBAY 50 day moving average ("EBAY 50 DMA"). A chart showing both of these popular moving averages is shown on this page for eBay.
10 Most Oversold S&P 500 Stocks
10 Most Overbought S&P 500 Stocks

10 ETFs With Stocks Insiders Are Buying
10 ETFs With Most Upside To Targets
The DividendRank Top 25
Warren Buffett Dividend Stocks
10 Cheap Dividend Stocks Under $10
10 Top DividendRank'ed Energy Stocks
The 10 Highest Yielding Preferred Stocks
The 15 Most Active S&P Call & Put Options
Quotes delayed 20 minutes

Email EnvelopeFree EBAY Email Alerts:
Get Dividend Alerts
Get SEC Filing Alerts
Video: Technical Analysis


If the video does not load after a few moments, Upgrade to the Latest Flash Player.
eBay (EBAY) is categorized under the Industrials sector; to help you further research DMA, below are some other companies in the same sector:

EFX DMA
EMR DMA
ETN DMA
EXPD DMA
FDX DMA
FICO DMA
FIS DMA
FTV DMA
GD DMA
GE DMA
More Industrials companies »


eBay DMA | www.StockDMA.com | Copyright © 2019 - 2025, All Rights Reserved

Nothing in StockDMA.com is intended to be investment advice, nor does it represent the opinion of, counsel from, or recommendations by BNK Invest Inc. or any of its affiliates, subsidiaries or partners. None of the information contained herein constitutes a recommendation that any particular security, portfolio, transaction, or investment strategy is suitable for any specific person. All viewers agree that under no circumstances will BNK Invest, Inc,. its subsidiaries, partners, officers, employees, affiliates, or agents be held liable for any loss or damage caused by your reliance on information obtained. By visiting, using or viewing this site, you agree to the following Full Disclaimer & Terms of Use and Privacy Policy. Video widget and market videos powered by Market News Video. Quote and option data delayed at least 15 minutes; stock quote data powered by Ticker Technologies, and Mergent.
X
Wait! Don't leave yet.
Want to receive our latest research absolutely free?


Click the button below for your complimentary copy of Your Early Retirement Portfolio: Dividends Up to 8.7%—Every Month—Forever.

You'll discover the details on 4 stocks and funds that pay you massive dividends as high as 8.7%.