EFX DMA


As of date:4/17/2025
EFX stock price:221.25
EFX 50 DMA:238.74
EFX 200 DMA:264.13
EFX MACD (200-50):25.39

Also see:
EFX Market Cap History
EFX Shares Outstanding History
EFX YTD Return
EFX RSI
EFX MACD
EFX Technical Analysis

PID Crosses Above Key Moving Average Level
20 hours, 2 minutes ago


CCI Crosses Above Key Moving Average Level
20 hours, 4 minutes ago


Notable Two Hundred Day Moving Average Cross - SNA
20 hours, 4 minutes ago


X-trackers International Real Estate (HAUZ) Shares Cross Above 200 DMA
20 hours, 22 minutes ago


IIIN Crosses Above Key Moving Average Level
20 hours, 22 minutes ago


Bullish Two Hundred Day Moving Average Cross - YEAR
Wednesday, April 16, 5:12 PM


Bullish Two Hundred Day Moving Average Cross - IEF
Wednesday, April 16, 5:09 PM


iShares iBonds Dec 2033 Term Treasury Breaks Above 200-Day Moving Average - Bullish for IBTO
Wednesday, April 16, 5:09 PM


Notable Two Hundred Day Moving Average Cross - AUR
Wednesday, April 16, 5:08 PM


CURV Makes Bullish Cross Above Critical Moving Average
Wednesday, April 16, 11:52 AM


Shares of KMLM Now Oversold
Wednesday, April 16, 11:52 AM


TKNO Crosses Above Key Moving Average Level
Wednesday, April 16, 11:44 AM


RCAT Crosses Below Key Moving Average Level
Wednesday, April 16, 11:42 AM


iShares iBonds Dec 2031 Term Treasury (IBTL) Shares Cross Above 200 DMA
Tuesday, April 15, 4:08 PM


iShares iBonds Dec 2032 Term Treasury Breaks Above 200-Day Moving Average - Bullish for IBTM
Tuesday, April 15, 4:08 PM


More Technical Analysis News

EFX DMAEFX MACD
Equifax Inc. is a global data, analytics, and technology company that aids financial institutions, companies, employers, and government agencies in making critical decisions. Its Workforce Solutions segment offers services for verifying income, employment, educational history, criminal justice data, and healthcare professional licensure in the U.S. The U.S. Information Solutions (USIS) segment provides consumer and commercial information solutions, including decisioning technology, identity management, analytical services, e-commerce fraud protection, and more. Internationally, Equifax offers similar products and services tailored to regional needs.

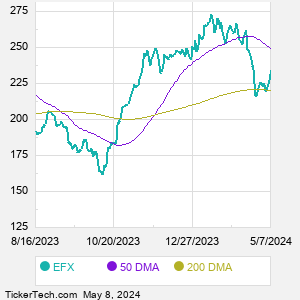
When researching a stock like Equifax, many investors are the most familiar with Fundamental Analysis — looking at a company's balance sheet, earnings, revenues, and what's happening in that company's underlying business. Investors who use Fundamental Analysis to identify good stocks to buy or sell can also benefit from EFX Technical Analysis to help find a good entry or exit point. Technical Analysis is blind to the fundamentals and looks only at the trading data for EFX stock — the real life supply and demand for the stock over time — and examines that data in different ways. One of those ways is to calculate a Simpe Moving Average ("SMA") by looking back a certain number of days. One of the most popular "longer look-backs" is the EFX 200 day moving average ("EFX 200 DMA"), while one of the most popular "shorter look-backs" is the EFX 50 day moving average ("EFX 50 DMA"). A chart showing both of these popular moving averages is shown on this page for Equifax.
10 Most Oversold S&P 500 Stocks
10 Most Overbought S&P 500 Stocks

10 ETFs With Stocks Insiders Are Buying
10 ETFs With Most Upside To Targets
The DividendRank Top 25
Warren Buffett Dividend Stocks
10 Cheap Dividend Stocks Under $10
10 Top DividendRank'ed Energy Stocks
The 10 Highest Yielding Preferred Stocks
The 15 Most Active S&P Call & Put Options
Quotes delayed 20 minutes

Email EnvelopeFree EFX Email Alerts:
Get Dividend Alerts
Get SEC Filing Alerts
Video: Technical Analysis


If the video does not load after a few moments, Upgrade to the Latest Flash Player.
Equifax (EFX) is categorized under the Industrials sector; to help you further research DMA, below are some other companies in the same sector:

EMR DMA
ETN DMA
EXPD DMA
FDX DMA
FICO DMA
FIS DMA
FTV DMA
GD DMA
GE DMA
GEV DMA
More Industrials companies »


EFX DMA | www.StockDMA.com | Copyright © 2019 - 2025, All Rights Reserved

Nothing in StockDMA.com is intended to be investment advice, nor does it represent the opinion of, counsel from, or recommendations by BNK Invest Inc. or any of its affiliates, subsidiaries or partners. None of the information contained herein constitutes a recommendation that any particular security, portfolio, transaction, or investment strategy is suitable for any specific person. All viewers agree that under no circumstances will BNK Invest, Inc,. its subsidiaries, partners, officers, employees, affiliates, or agents be held liable for any loss or damage caused by your reliance on information obtained. By visiting, using or viewing this site, you agree to the following Full Disclaimer & Terms of Use and Privacy Policy. Video widget and market videos powered by Market News Video. Quote and option data delayed at least 15 minutes; stock quote data powered by Ticker Technologies, and Mergent.
X
Wait! Don't leave yet.
Want to receive our latest research absolutely free?


Click the button below for your complimentary copy of Your Early Retirement Portfolio: Dividends Up to 8.7%—Every Month—Forever.

You'll discover the details on 4 stocks and funds that pay you massive dividends as high as 8.7%.