FANG DMA


As of date:3/15/2024
FANG stock price:189.94
FANG 50 DMA:163.33
FANG 200 DMA:147.99
FANG MACD (200-50):-15.34

Also see:
FANG Market Cap History
FANG Shares Outstanding History
FANG YTD Return
FANG RSI
FANG MACD
FANG Technical Analysis

FWONK Crosses Below Key Moving Average Level
1 hour, 19 minutes ago


Lands' End Breaks Below 200-Day Moving Average - Notable for LE
1 hour, 25 minutes ago


Notable Two Hundred Day Moving Average Cross - CATY
1 hour, 28 minutes ago


MEOH Makes Bullish Cross Above Critical Moving Average
1 hour, 28 minutes ago


HELE Makes Notable Cross Below Critical Moving Average
1 hour, 29 minutes ago


iShares 3-7 Year Treasury Bond (IEI) Shares Cross Below 200 DMA
1 hour, 42 minutes ago


First Trust TCW Opportunistic Fixed Income Breaks Below 200-Day Moving Average - Notable for FIXD
1 hour, 42 minutes ago


BSMO Makes Notable Cross Below Critical Moving Average
1 hour, 48 minutes ago


TMV Makes Bullish Cross Above Critical Moving Average
1 hour, 49 minutes ago


Invesco DB Oil Fund Breaks Above 200-Day Moving Average - Bullish for DBO
1 hour, 49 minutes ago


iShares J.P. Morgan EM Local Currency Bond Breaks Below 200-Day Moving Average - Notable for LEMB
1 hour, 49 minutes ago


BLV Crosses Below Key Moving Average Level
1 hour, 49 minutes ago


LI Makes Notable Cross Below Critical Moving Average
6 hours, 10 minutes ago


Bullish Two Hundred Day Moving Average Cross - NVEI
6 hours, 10 minutes ago


Terns Pharmaceuticals (TERN) Shares Cross Below 200 DMA
6 hours, 12 minutes ago


More Technical Analysis News

FANG DMAFANG MACD
Diamondback Energy is an independent oil and natural gas company. Co. operates in the following segments: the upstream segment, which is engaged in the acquisition, development, exploration and exploitation of unconventional, onshore oil and natural gas reserves primarily in the Permian Basin in West Texas; and (ii) through its subsidiary, Rattler Midstream LP, the midstream operations segment, which is focused on ownership, operation, development and acquisition of the midstream infrastructure assets in the Midland and Delaware Basins of the Permian Basin.

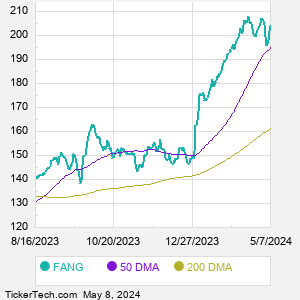
When researching a stock like Diamondback Energy, many investors are the most familiar with Fundamental Analysis — looking at a company's balance sheet, earnings, revenues, and what's happening in that company's underlying business. Investors who use Fundamental Analysis to identify good stocks to buy or sell can also benefit from FANG Technical Analysis to help find a good entry or exit point. Technical Analysis is blind to the fundamentals and looks only at the trading data for FANG stock — the real life supply and demand for the stock over time — and examines that data in different ways. One of those ways is to calculate a Simpe Moving Average ("SMA") by looking back a certain number of days. One of the most popular "longer look-backs" is the FANG 200 day moving average ("FANG 200 DMA"), while one of the most popular "shorter look-backs" is the FANG 50 day moving average ("FANG 50 DMA"). A chart showing both of these popular moving averages is shown on this page for Diamondback Energy.
10 Most Oversold S&P 500 Stocks
10 Most Overbought S&P 500 Stocks

10 ETFs With Stocks Insiders Are Buying
10 ETFs With Most Upside To Targets
The DividendRank Top 25
Warren Buffett Dividend Stocks
10 Cheap Dividend Stocks Under $10
10 Top DividendRank'ed Energy Stocks
The 10 Highest Yielding Preferred Stocks
The 15 Most Active S&P Call & Put Options
Quotes delayed 20 minutes

Email EnvelopeFree FANG Email Alerts:
Get Dividend Alerts
Get SEC Filing Alerts
Video: Technical Analysis


If the video does not load after a few moments, Upgrade to the Latest Flash Player.
Diamondback Energy (FANG) is categorized under the Energy sector; to help you further research DMA, below are some other companies in the same sector:

HAL DMA
HES DMA
KMI DMA
MPC DMA
MRO DMA
OKE DMA
OXY DMA
PSX DMA
PXD DMA
SLB DMA
More Energy companies »


FANG DMA | www.StockDMA.com | Copyright © 2019 - 2024, All Rights Reserved

Nothing in StockDMA.com is intended to be investment advice, nor does it represent the opinion of, counsel from, or recommendations by BNK Invest Inc. or any of its affiliates, subsidiaries or partners. None of the information contained herein constitutes a recommendation that any particular security, portfolio, transaction, or investment strategy is suitable for any specific person. All viewers agree that under no circumstances will BNK Invest, Inc,. its subsidiaries, partners, officers, employees, affiliates, or agents be held liable for any loss or damage caused by your reliance on information obtained. By visiting, using or viewing this site, you agree to the following Full Disclaimer & Terms of Use and Privacy Policy. Video widget and market videos powered by Market News Video. Quote and option data delayed at least 15 minutes; stock quote data powered by Ticker Technologies, and Mergent.
X
Wait! Don't leave yet.
Want to receive our latest research absolutely free?


Click the button below for your complimentary copy of Your Early Retirement Portfolio: Dividends Up to 9.5%—Every Month—Forever.

You'll discover the details on 4 stocks and funds that pay you massive dividends as high as 9.5%.