HIG DMA: Hartford Financial Services Group Moving Average Chart

HIG DMA data is shown as of 6/16/2026, and includes a 50-day DMA of 133.57 with Hartford Financial Services Group trading at 131.02. Moving averages help investors compare the current stock price with recent price trends, including commonly watched 50-day and 200-day moving averages. A stock trading above or below its moving averages can signal changing technical momentum, trend strength, or possible support and resistance areas.

HIG DMA: Hartford Financial Services Group Moving Average Chart


As of date:6/16/2026
HIG stock price:131.02
HIG 50 DMA:133.57
HIG 200 DMA:132.77
HIG MACD (200-50):-0.80

Also see:
HIG Market Cap History
HIG Shares Outstanding History
HIG YTD Return
HIG RSI
HIG MACD
HIG Technical Analysis

CES Energy Solutions Shares Enter Oversold Territory as RSI Falls Below 30
1 hour, 13 minutes ago


Adecoagro Stock Enters Oversold Territory as RSI Falls Below 30
1 hour, 24 minutes ago


Zoetis Stock Enters Oversold Territory as Dividend Yield Rises
1 hour, 48 minutes ago


Natural Resource Partners Stock Enters Oversold Territory as RSI Falls Below 30
1 hour, 48 minutes ago


United States Brent Oil Fund ETF Enters Oversold Territory as Selling Pressure Builds
Monday, June 15, 5:06 PM


ACRES Commercial Realty Stock Enters Oversold Territory as RSI Falls to 22.6
Monday, June 15, 5:03 PM


Leidos Holdings Stock Enters Oversold Territory as RSI Drops and Dividend Yield Rises
Monday, June 15, 4:07 PM


TotalEnergies Stock Enters Oversold Territory as RSI Falls Below 30
Monday, June 15, 3:52 PM


Fairfax Financial Series K Preferred Shares Top 5% Yield as Price Nears Reset Preferred Par
Monday, June 15, 2:49 PM


Boyd Group Services Stock Enters Oversold Territory as RSI Falls Below 30
Friday, June 12, 4:35 PM


Dolby Laboratories Stock Enters Oversold Territory as Dividend Yield Rises
Friday, June 12, 4:00 PM


Array Digital Infrastructure Stock Enters Oversold Territory as RSI Falls Below 30
Thursday, June 11, 4:42 PM


West Vault Mining Stock Enters Oversold Territory as RSI Falls Below 30
Thursday, June 11, 4:37 PM


Amdocs Stock Enters Oversold Territory as Dividend Yield Rises
Thursday, June 11, 4:34 PM


EQT Stock Enters Oversold Territory as RSI Falls Below 30
Thursday, June 11, 4:31 PM


More Technical Analysis News

HIG DMAHIG MACD
The Hartford Financial Services Group, Inc. is a holding company. Co.'s segments include Commercial Lines, Personal Lines, Property & Casualty Other Operations, Group Benefits and Hartford Funds. The Commercial Lines segment provides a variety of insurance products and risk management services in the U.S. and internationally. Personal Lines segment provides automobile, homeowners and personal umbrella coverage to individuals across the U.S.. The Property & Casualty Other Operations segment includes certain property and casualty operations.

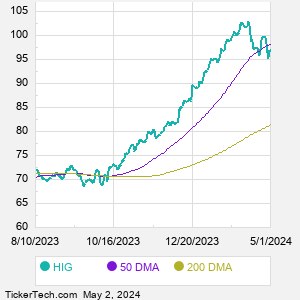
When researching a stock like Hartford Financial Services Group, many investors are the most familiar with Fundamental Analysis — looking at a company's balance sheet, earnings, revenues, and what's happening in that company's underlying business. Investors who use Fundamental Analysis to identify good stocks to buy or sell can also benefit from HIG Technical Analysis to help find a good entry or exit point. Technical Analysis is blind to the fundamentals and looks only at the trading data for HIG stock — the real life supply and demand for the stock over time — and examines that data in different ways. One of those ways is to calculate a Simpe Moving Average ("SMA") by looking back a certain number of days. One of the most popular "longer look-backs" is the HIG 200 day moving average ("HIG 200 DMA"), while one of the most popular "shorter look-backs" is the HIG 50 day moving average ("HIG 50 DMA"). A chart showing both of these popular moving averages is shown on this page for Hartford Financial Services Group.
10 Most Oversold S&P 500 Stocks
10 Most Overbought S&P 500 Stocks

10 ETFs With Stocks Insiders Are Buying
10 ETFs With Most Upside To Targets
The DividendRank Top 25
Warren Buffett Dividend Stocks
10 Cheap Dividend Stocks Under $10
10 Top DividendRank'ed Energy Stocks
The 10 Highest Yielding Preferred Stocks
The 15 Most Active S&P Call & Put Options
Quotes delayed 20 minutes

Email EnvelopeFree HIG Email Alerts:
Get Dividend Alerts
Get SEC Filing Alerts
Video: Technical Analysis
Hartford Financial Services Group (HIG) is categorized under the Financials sector; to help you further research DMA, below are some other companies in the same sector:

HST DMA
HUM DMA
IBKR DMA
ICE DMA
INVH DMA
IVZ DMA
JPM DMA
KEY DMA
KIM DMA
KKR DMA
More Financials companies »
 

HIG DMA: Hartford Financial Services Group Moving Average Chart | www.StockDMA.com | Copyright © 2019 - 2026, All Rights Reserved

Nothing in StockDMA.com is intended to be investment advice, nor does it represent the opinion of, counsel from, or recommendations by BNK Invest Inc. or any of its affiliates, subsidiaries or partners. None of the information contained herein constitutes a recommendation that any particular security, portfolio, transaction, or investment strategy is suitable for any specific person. All viewers agree that under no circumstances will BNK Invest, Inc,. its subsidiaries, partners, officers, employees, affiliates, or agents be held liable for any loss or damage caused by your reliance on information obtained. By visiting, using or viewing this site, you agree to the following Full Disclaimer & Terms of Use and Privacy Policy. Video widget and market videos powered by Market News Video. Quote and option data delayed at least 15 minutes; stock quote data powered by Ticker Technologies, and Mergent.
X
Wait! Don't leave yet.
Want to receive our latest research absolutely free?


Click the button below for your complimentary copy of Your Early Retirement Portfolio: Dividends Up to 8.2%—Every Month—Forever.

You'll discover the details on 4 stocks and funds that pay you massive dividends as high as 8.2%.