Mohawk Industries is a global flooring manufacturer. Co.'s segments are: Global Ceramic, which designs, manufactures, sources, distributes and markets a line of ceramic, porcelain and natural stone tile products used for floor and wall applications in residential and commercial channels; Flooring North America, which designs, manufactures, sources and distributes a range of floor covering products in a variety of colors, textures and patterns; and Flooring Rest of the World, which designs, manufactures, sources and distributes a variety of laminate, luxury vinyl tile and sheet vinyl, wood flooring, broadloom carpet and carpet tile collections used in the residential and commercial markets.
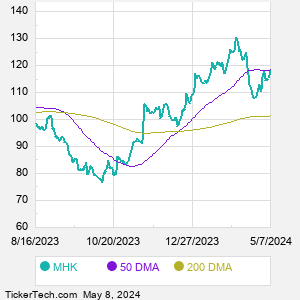
When researching a stock like Mohawk Industries, many investors are the most familiar with Fundamental Analysis — looking at a company's balance sheet, earnings, revenues, and what's happening in that company's underlying business. Investors who use Fundamental Analysis to identify good stocks to buy or sell can also benefit from MHK Technical Analysis to help find a good entry or exit point. Technical Analysis is blind to the fundamentals and looks only at the trading data for MHK stock — the real life supply and demand for the stock over time — and examines that data in different ways. One of those ways is to calculate a Simpe Moving Average ("SMA") by looking back a certain number of days. One of the most popular "longer look-backs" is the MHK 200 day moving average ("MHK 200 DMA"), while one of the most popular "shorter look-backs" is the MHK 50 day moving average ("MHK 50 DMA"). A chart showing both of these popular moving averages is shown on this page for Mohawk Industries. |