| STI DMA Data | ||||||||||
Also see: |


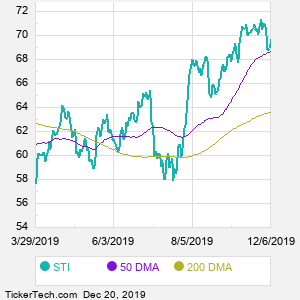
| STI DMA Chart |
  |
| About Solidion Technology Inc |
| Nubia Brand International is a blank check company formed for the purpose of effecting a merger, capital stock exchange, asset acquisition, stock purchase, reorganization or similar business combination with one or more businesses. When researching a stock like SunTrust Banks, many investors are the most familiar with Fundamental Analysis — looking at a company's balance sheet, earnings, revenues, and what's happening in that company's underlying business. Investors who use Fundamental Analysis to identify good stocks to buy or sell can also benefit from STI Technical Analysis to help find a good entry or exit point. Technical Analysis is blind to the fundamentals and looks only at the trading data for STI stock — the real life supply and demand for the stock over time — and examines that data in different ways. One of those ways is to calculate a Simpe Moving Average ("SMA") by looking back a certain number of days. One of the most popular "longer look-backs" is the STI 200 day moving average ("STI 200 DMA"), while one of the most popular "shorter look-backs" is the STI 50 day moving average ("STI 50 DMA"). A chart showing both of these popular moving averages is shown on this page for SunTrust Banks. |
| STI Current Stock Quote |
Get Dividend Alerts Get SEC Filing Alerts |
| STI Stock Price Chart |
| Video: Technical Analysis | |
|
| STI DMA Peers |