TFX DMA


As of date:3/26/2025
TFX stock price:140.23
TFX 50 DMA:160.80
TFX 200 DMA:201.77
TFX MACD (200-50):40.97

Also see:
TFX Market Cap History
TFX Shares Outstanding History
TFX YTD Return
TFX RSI
TFX MACD
TFX Technical Analysis

MasterCraft Boat Holdings (MCFT) Shares Cross Below 200 DMA
1 hour, 24 minutes ago


Bullish Two Hundred Day Moving Average Cross - LAND
1 hour, 24 minutes ago


NEOG Makes Bullish Cross Above Critical Moving Average
1 hour, 28 minutes ago


IFNNF Makes Bullish Cross Above Critical Moving Average
1 hour, 28 minutes ago


MBWM Crosses Above Key Moving Average Level
1 hour, 28 minutes ago


Bullish Two Hundred Day Moving Average Cross - PERI
1 hour, 28 minutes ago


CRGY Crosses Above Key Moving Average Level
1 hour, 43 minutes ago


Bullish Two Hundred Day Moving Average Cross - PAPI
1 hour, 49 minutes ago


ETC 6 Meridian Hedged Equity-Index Option Strategy (SIXH) Shares Cross Above 200 DMA
1 hour, 49 minutes ago


PAC Makes Bullish Cross Above Critical Moving Average
1 hour, 49 minutes ago


XSLV Crosses Above Key Moving Average Level
1 hour, 56 minutes ago


The Real Estate Select Sector SPDR Fund Breaks Above 200-Day Moving Average - Bullish for XLRE
1 hour, 58 minutes ago


ProShares Russell 2000 Dividend Growers (SMDV) Shares Cross Above 200 DMA
1 hour, 58 minutes ago


SCHD Makes Bullish Cross Above Critical Moving Average
1 hour, 59 minutes ago


BMTC Group Breaks Below 200-Day Moving Average - Notable for GBT.CA
2 hours, 2 minutes ago


More Technical Analysis News

TFX DMATFX MACD
Teleflex Incorporated is a global provider of medical technology products. Co. primarily designs, develops, manufactures and supplies single-use medical devices used by hospitals and healthcare providers for common diagnostic and therapeutic procedures in critical care and surgical applications. Co. has four segments: Americas, EMEA (Europe, the Middle East and Africa), Asia (Asia Pacific) and OEM (Original Equipment Manufacturer and Development Services). OEM segment designs, manufactures and supplies devices and instruments for other medical device manufacturers.

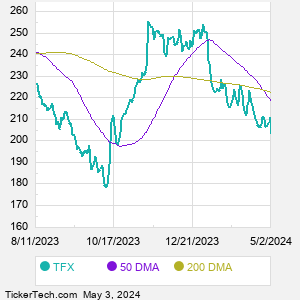
When researching a stock like Teleflexorporated, many investors are the most familiar with Fundamental Analysis — looking at a company's balance sheet, earnings, revenues, and what's happening in that company's underlying business. Investors who use Fundamental Analysis to identify good stocks to buy or sell can also benefit from TFX Technical Analysis to help find a good entry or exit point. Technical Analysis is blind to the fundamentals and looks only at the trading data for TFX stock — the real life supply and demand for the stock over time — and examines that data in different ways. One of those ways is to calculate a Simpe Moving Average ("SMA") by looking back a certain number of days. One of the most popular "longer look-backs" is the TFX 200 day moving average ("TFX 200 DMA"), while one of the most popular "shorter look-backs" is the TFX 50 day moving average ("TFX 50 DMA"). A chart showing both of these popular moving averages is shown on this page for Teleflexorporated.
10 Most Oversold S&P 500 Stocks
10 Most Overbought S&P 500 Stocks

10 ETFs With Stocks Insiders Are Buying
10 ETFs With Most Upside To Targets
The DividendRank Top 25
Warren Buffett Dividend Stocks
10 Cheap Dividend Stocks Under $10
10 Top DividendRank'ed Energy Stocks
The 10 Highest Yielding Preferred Stocks
The 15 Most Active S&P Call & Put Options
Quotes delayed 20 minutes

Email EnvelopeFree TFX Email Alerts:
Get Dividend Alerts
Get SEC Filing Alerts
Video: Technical Analysis


If the video does not load after a few moments, Upgrade to the Latest Flash Player.
 

TFX DMA | www.StockDMA.com | Copyright © 2019 - 2025, All Rights Reserved

Nothing in StockDMA.com is intended to be investment advice, nor does it represent the opinion of, counsel from, or recommendations by BNK Invest Inc. or any of its affiliates, subsidiaries or partners. None of the information contained herein constitutes a recommendation that any particular security, portfolio, transaction, or investment strategy is suitable for any specific person. All viewers agree that under no circumstances will BNK Invest, Inc,. its subsidiaries, partners, officers, employees, affiliates, or agents be held liable for any loss or damage caused by your reliance on information obtained. By visiting, using or viewing this site, you agree to the following Full Disclaimer & Terms of Use and Privacy Policy. Video widget and market videos powered by Market News Video. Quote and option data delayed at least 15 minutes; stock quote data powered by Ticker Technologies, and Mergent.
X
Wait! Don't leave yet.
Want to receive our latest research absolutely free?


Click the button below for your complimentary copy of Your Early Retirement Portfolio: Dividends Up to 7.6%—Every Month—Forever.

You'll discover the details on 4 stocks and funds that pay you massive dividends as high as 7.6%.