ZBRA DMA


As of date:4/22/2024
ZBRA stock price:271.63
ZBRA 50 DMA:283.38
ZBRA 200 DMA:257.73
ZBRA MACD (200-50):-25.65

Also see:
ZBRA Market Cap History
ZBRA Shares Outstanding History
ZBRA YTD Return
ZBRA RSI
ZBRA MACD
ZBRA Technical Analysis

Confluent Breaks Above 200-Day Moving Average - Bullish for CFLT
56 minutes ago


OLLI Makes Bullish Cross Above Critical Moving Average
1 hour, 16 minutes ago


Bullish Two Hundred Day Moving Average Cross - AY
1 hour, 17 minutes ago


Calamos Convertible and High Income Fund (CHY) Shares Cross Above 200 DMA
1 hour, 22 minutes ago


SYBT Crosses Above Key Moving Average Level
1 hour, 30 minutes ago


Apollo Commercial Real Estate Finance (ARI) Shares Cross Above 200 DMA
1 hour, 33 minutes ago


BlackRock Utility and Infrastructure Trust Breaks Above 200-Day Moving Average - Bullish for BUI
1 hour, 35 minutes ago


Bullish Two Hundred Day Moving Average Cross - UVV
1 hour, 38 minutes ago


ESE Makes Bullish Cross Above Critical Moving Average
1 hour, 38 minutes ago


Bullish Two Hundred Day Moving Average Cross - PHG
1 hour, 38 minutes ago


Haemonetics (HAE) Shares Cross Above 200 DMA
1 hour, 38 minutes ago


Bullish Two Hundred Day Moving Average Cross - SGY.CA
1 hour, 38 minutes ago


Cineplex Breaks Above 200-Day Moving Average - Bullish for CGX.CA
1 hour, 38 minutes ago


Bullish Two Hundred Day Moving Average Cross - PHVS
4 hours, 26 minutes ago


Bullish Two Hundred Day Moving Average Cross - BLTE
4 hours, 27 minutes ago


More Technical Analysis News

ZBRA DMAZBRA MACD
Zebra Technologies designs, manufactures, and sells automatic identification and data capture products, including mobile computers, barcode scanners and imagers, radio frequency identification devices (RFID) readers, printers for barcode labeling and personal identification, real-time location systems, related accessories and supplies, such as labels and other consumables. Co.'s segments are: Asset Intelligence and Tracking, which includes barcode and card printing, supplies, services, and location solutions; and Enterprise Visibility and Mobility, which includes mobile computing, data capture, RFID, fixed industrial scanning and machine vision, services and workflow optimization solutions.

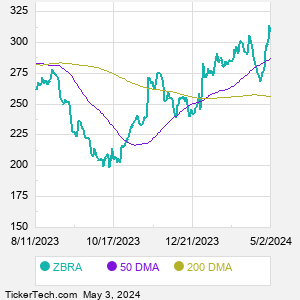
When researching a stock like Zebra Technologies, many investors are the most familiar with Fundamental Analysis — looking at a company's balance sheet, earnings, revenues, and what's happening in that company's underlying business. Investors who use Fundamental Analysis to identify good stocks to buy or sell can also benefit from ZBRA Technical Analysis to help find a good entry or exit point. Technical Analysis is blind to the fundamentals and looks only at the trading data for ZBRA stock — the real life supply and demand for the stock over time — and examines that data in different ways. One of those ways is to calculate a Simpe Moving Average ("SMA") by looking back a certain number of days. One of the most popular "longer look-backs" is the ZBRA 200 day moving average ("ZBRA 200 DMA"), while one of the most popular "shorter look-backs" is the ZBRA 50 day moving average ("ZBRA 50 DMA"). A chart showing both of these popular moving averages is shown on this page for Zebra Technologies.
10 Most Oversold S&P 500 Stocks
10 Most Overbought S&P 500 Stocks

10 ETFs With Stocks Insiders Are Buying
10 ETFs With Most Upside To Targets
The DividendRank Top 25
Warren Buffett Dividend Stocks
10 Cheap Dividend Stocks Under $10
10 Top DividendRank'ed Energy Stocks
The 10 Highest Yielding Preferred Stocks
The 15 Most Active S&P Call & Put Options
Quotes delayed 20 minutes

Email EnvelopeFree ZBRA Email Alerts:
Get Dividend Alerts
Get SEC Filing Alerts
Video: Technical Analysis


If the video does not load after a few moments, Upgrade to the Latest Flash Player.
Zebra Technologies (ZBRA) is categorized under the Technology sector; to help you further research DMA, below are some other companies in the same sector:

AAPL DMA
ABNB DMA
ADBE DMA
ADI DMA
ADSK DMA
AKAM DMA
AMAT DMA
AMD DMA
ANET DMA
ANSS DMA
More Technology companies »


ZBRA DMA | www.StockDMA.com | Copyright © 2019 - 2024, All Rights Reserved

Nothing in StockDMA.com is intended to be investment advice, nor does it represent the opinion of, counsel from, or recommendations by BNK Invest Inc. or any of its affiliates, subsidiaries or partners. None of the information contained herein constitutes a recommendation that any particular security, portfolio, transaction, or investment strategy is suitable for any specific person. All viewers agree that under no circumstances will BNK Invest, Inc,. its subsidiaries, partners, officers, employees, affiliates, or agents be held liable for any loss or damage caused by your reliance on information obtained. By visiting, using or viewing this site, you agree to the following Full Disclaimer & Terms of Use and Privacy Policy. Video widget and market videos powered by Market News Video. Quote and option data delayed at least 15 minutes; stock quote data powered by Ticker Technologies, and Mergent.
X
Wait! Don't leave yet.
Want to receive our latest research absolutely free?


Click the button below for your complimentary copy of Your Early Retirement Portfolio: Dividends Up to 8.7%—Every Month—Forever.

You'll discover the details on 4 stocks and funds that pay you massive dividends as high as 8.7%.