Agilent Technologies is engaged in life sciences, diagnostics and applied chemical markets. Co.'s segments are: Life Sciences and Applied Markets Business, which provides instruments and software that enable customers to identify, quantify and analyze the physical and biological properties of substances and products; Diagnostics and Genomics Business, which includes the genomics, nucleic acid contract manufacturing and research and development, pathology, companion diagnostics, reagent partnership and biomolecular analysis businesses; and Agilent CrossLab Business, which spans the entire lab with its consumables and services portfolio to improve customer outcomes.
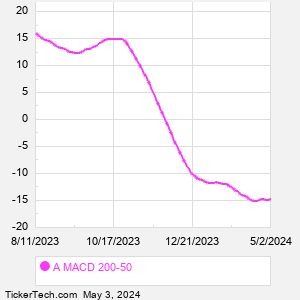
When researching a stock like Agilent Technologies, many investors are the most familiar with Fundamental Analysis — looking at a company's balance sheet, earnings, revenues, and what's happening in that company's underlying business. Investors who use Fundamental Analysis to identify good stocks to buy or sell can also benefit from A Technical Analysis to help find a good entry or exit point. Technical Analysis is blind to the fundamentals and looks only at the trading data for A stock — the real life supply and demand for the stock over time — and examines that data in different ways. One of those ways is to calculate a Simpe Moving Average ("SMA") by looking back a certain number of days. One of the most popular "longer look-backs" is the A 200 day moving average ("A 200 DMA"), while one of the most popular "shorter look-backs" is the A 50 day moving average ("A 50 DMA"). A chart showing both of these popular moving averages is shown on this page for Agilent Technologies. |