Boston Properties is a real estate investment trust that develops, owns and manages office properties. Co.'s properties are concentrated in six markets: Boston, Los Angeles, New York, San Francisco, Seattle and Washington, DC. Co. is a real estate company, with in-house capabilities and resources in acquisitions, development, financing, capital markets, construction management, property management, marketing, leasing, accounting, risk management, tax and legal services. Co. manages Boston Properties Limited Partnership, which is the entity through which Co. conducts substantially all of its business and owns, either directly or through subsidiaries, substantially all of its assets.
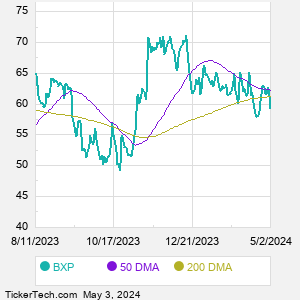
When researching a stock like Boston Properties, many investors are the most familiar with Fundamental Analysis — looking at a company's balance sheet, earnings, revenues, and what's happening in that company's underlying business. Investors who use Fundamental Analysis to identify good stocks to buy or sell can also benefit from BXP Technical Analysis to help find a good entry or exit point. Technical Analysis is blind to the fundamentals and looks only at the trading data for BXP stock — the real life supply and demand for the stock over time — and examines that data in different ways. One of those ways is to calculate a Simpe Moving Average ("SMA") by looking back a certain number of days. One of the most popular "longer look-backs" is the BXP 200 day moving average ("BXP 200 DMA"), while one of the most popular "shorter look-backs" is the BXP 50 day moving average ("BXP 50 DMA"). A chart showing both of these popular moving averages is shown on this page for Boston Properties. |