JNJ DMA


As of date:4/17/2025
JNJ stock price:157.47
JNJ 50 DMA:159.49
JNJ 200 DMA:154.89
JNJ MACD (200-50):-4.60

Also see:
JNJ Market Cap History
JNJ Shares Outstanding History
JNJ YTD Return
JNJ RSI
JNJ MACD
JNJ Technical Analysis

PID Crosses Above Key Moving Average Level
19 hours, 2 minutes ago


CCI Crosses Above Key Moving Average Level
19 hours, 4 minutes ago


Notable Two Hundred Day Moving Average Cross - SNA
19 hours, 4 minutes ago


X-trackers International Real Estate (HAUZ) Shares Cross Above 200 DMA
19 hours, 22 minutes ago


IIIN Crosses Above Key Moving Average Level
19 hours, 22 minutes ago


Bullish Two Hundred Day Moving Average Cross - YEAR
Wednesday, April 16, 5:12 PM


Bullish Two Hundred Day Moving Average Cross - IEF
Wednesday, April 16, 5:09 PM


iShares iBonds Dec 2033 Term Treasury Breaks Above 200-Day Moving Average - Bullish for IBTO
Wednesday, April 16, 5:09 PM


Notable Two Hundred Day Moving Average Cross - AUR
Wednesday, April 16, 5:08 PM


CURV Makes Bullish Cross Above Critical Moving Average
Wednesday, April 16, 11:52 AM


Shares of KMLM Now Oversold
Wednesday, April 16, 11:52 AM


TKNO Crosses Above Key Moving Average Level
Wednesday, April 16, 11:44 AM


RCAT Crosses Below Key Moving Average Level
Wednesday, April 16, 11:42 AM


iShares iBonds Dec 2031 Term Treasury (IBTL) Shares Cross Above 200 DMA
Tuesday, April 15, 4:08 PM


iShares iBonds Dec 2032 Term Treasury Breaks Above 200-Day Moving Average - Bullish for IBTM
Tuesday, April 15, 4:08 PM


More Technical Analysis News

JNJ DMAJNJ MACD
Johnson & Johnson, through its subsidiaries, is engaged in the research and development, manufacture, and sale of a range of products in the healthcare field. Co.'s primary focus is products related to human health and well-being. It operates through two segments: Innovative Medicine and MedTech. The Innovative Medicine segment is focused on various therapeutic areas, including immunology, infectious diseases, neuroscience, oncology, pulmonary hypertension, and cardiovascular and metabolic diseases. Products in this segment are distributed directly to retailers, wholesalers, distributors, hospitals, and healthcare professionals for prescription use.

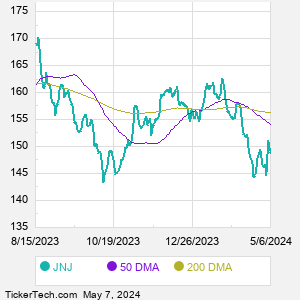
When researching a stock like Johnson and Johnson, many investors are the most familiar with Fundamental Analysis — looking at a company's balance sheet, earnings, revenues, and what's happening in that company's underlying business. Investors who use Fundamental Analysis to identify good stocks to buy or sell can also benefit from JNJ Technical Analysis to help find a good entry or exit point. Technical Analysis is blind to the fundamentals and looks only at the trading data for JNJ stock — the real life supply and demand for the stock over time — and examines that data in different ways. One of those ways is to calculate a Simpe Moving Average ("SMA") by looking back a certain number of days. One of the most popular "longer look-backs" is the JNJ 200 day moving average ("JNJ 200 DMA"), while one of the most popular "shorter look-backs" is the JNJ 50 day moving average ("JNJ 50 DMA"). A chart showing both of these popular moving averages is shown on this page for Johnson and Johnson.
10 Most Oversold S&P 500 Stocks
10 Most Overbought S&P 500 Stocks

10 ETFs With Stocks Insiders Are Buying
10 ETFs With Most Upside To Targets
The DividendRank Top 25
Warren Buffett Dividend Stocks
10 Cheap Dividend Stocks Under $10
10 Top DividendRank'ed Energy Stocks
The 10 Highest Yielding Preferred Stocks
The 15 Most Active S&P Call & Put Options
Quotes delayed 20 minutes

Email EnvelopeFree JNJ Email Alerts:
Get Dividend Alerts
Get SEC Filing Alerts
Video: Technical Analysis


If the video does not load after a few moments, Upgrade to the Latest Flash Player.
Johnson and Johnson (JNJ) is categorized under the Healthcare sector; to help you further research DMA, below are some other companies in the same sector:

LH DMA
LLY DMA
MCK DMA
MDT DMA
MMM DMA
MOH DMA
MRK DMA
MRNA DMA
PFE DMA
PODD DMA
More Healthcare companies »


JNJ DMA | www.StockDMA.com | Copyright © 2019 - 2025, All Rights Reserved

Nothing in StockDMA.com is intended to be investment advice, nor does it represent the opinion of, counsel from, or recommendations by BNK Invest Inc. or any of its affiliates, subsidiaries or partners. None of the information contained herein constitutes a recommendation that any particular security, portfolio, transaction, or investment strategy is suitable for any specific person. All viewers agree that under no circumstances will BNK Invest, Inc,. its subsidiaries, partners, officers, employees, affiliates, or agents be held liable for any loss or damage caused by your reliance on information obtained. By visiting, using or viewing this site, you agree to the following Full Disclaimer & Terms of Use and Privacy Policy. Video widget and market videos powered by Market News Video. Quote and option data delayed at least 15 minutes; stock quote data powered by Ticker Technologies, and Mergent.
X
Wait! Don't leave yet.
Want to receive our latest research absolutely free?


Click the button below for your complimentary copy of Your Early Retirement Portfolio: Dividends Up to 8.7%—Every Month—Forever.

You'll discover the details on 4 stocks and funds that pay you massive dividends as high as 8.7%.