Under Armour is engaged in developing, marketing and distributing branded performance apparel, footwear and accessories for men, women and youth. Co.'s product offerings consist of apparel, footwear and accessories for men, women and youth. Co. markets its products at various price levels. Co.'s apparel comes in three primary fit types: compression (tight fit), fitted (athletic fit) and loose (relaxed fit). Footwear includes products for running, training, basketball, cleated sports, recovery and outdoor applications. Accessories primarily includes the sale of athletic performance gloves, bags, headwear, socks and sports masks.
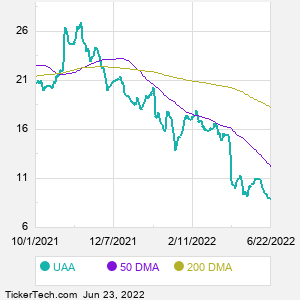
When researching a stock like Under Armour, many investors are the most familiar with Fundamental Analysis — looking at a company's balance sheet, earnings, revenues, and what's happening in that company's underlying business. Investors who use Fundamental Analysis to identify good stocks to buy or sell can also benefit from UAA Technical Analysis to help find a good entry or exit point. Technical Analysis is blind to the fundamentals and looks only at the trading data for UAA stock — the real life supply and demand for the stock over time — and examines that data in different ways. One of those ways is to calculate a Simpe Moving Average ("SMA") by looking back a certain number of days. One of the most popular "longer look-backs" is the UAA 200 day moving average ("UAA 200 DMA"), while one of the most popular "shorter look-backs" is the UAA 50 day moving average ("UAA 50 DMA"). A chart showing both of these popular moving averages is shown on this page for Under Armour. |