CSGP DMA
As of date:6/8/2023
CSGP stock price:80.94
CSGP 50 DMA:74.12
CSGP 200 DMA:75.11
CSGP MACD (200-50):0.99

Also see:
CSGP Market Cap History
CSGP Shares Outstanding History
CSGP YTD Return
CSGP RSI
CSGP MACD
CSGP Technical Analysis

ODFL Crosses Below Key Moving Average Level
1 hour, 40 minutes ago


BlackRock Debt Strategies Fund (DSU) Shares Cross Below 200 DMA
1 hour, 44 minutes ago


UITB Breaks Below 200-Day Moving Average - Notable for UITB
1 hour, 44 minutes ago


OOMA Crosses Above Key Moving Average Level
1 hour, 45 minutes ago


HYBB Crosses Above Key Moving Average Level
1 hour, 57 minutes ago


iShares Core Dividend (DIVB) Shares Cross Above 200 DMA
1 hour, 58 minutes ago


Dye & Durham Breaks Above 200-Day Moving Average - Bullish for DND.CA
1 hour, 59 minutes ago


Bullish Two Hundred Day Moving Average Cross - AVO
5 hours, 44 minutes ago


Robinhood Markets (HOOD) Shares Cross Above 200 DMA
5 hours, 45 minutes ago


Notable Two Hundred Day Moving Average Cross - KROS
5 hours, 45 minutes ago


CSIQ Crosses Below Key Moving Average Level
5 hours, 47 minutes ago


Fidelity D&D Bancorp (FDBC) Shares Cross Above 200 DMA
6 hours, 23 minutes ago


Qualcomm Breaks Above 200-Day Moving Average - Bullish for QCOM
6 hours, 23 minutes ago


Notable Two Hundred Day Moving Average Cross - GATO
6 hours, 32 minutes ago


Cornerstone Total Return Fund Breaks Above 200-Day Moving Average - Bullish for CRF
6 hours, 32 minutes ago


More Technical Analysis News

CSGP DMACSGP MACD
CoStar Group is a provider of information, analytics, online marketplace and auction services to the commercial real estate and related business community through its proprietary database of commercial real estate information and related tools. Co. provides online marketplaces for commercial real estate, apartment rentals, residential real estate, land for sale and businesses for sale, and its services are typically distributed to its clients under subscription-based agreements that typically renew automatically. Co. operates within two operating segments, North America, which includes the U.S. and Canada, and International, which primarily includes Europe, Asia-Pacific and Latin America.

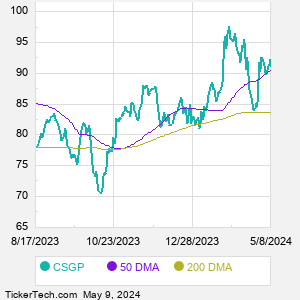
When researching a stock like CoStar Group, many investors are the most familiar with Fundamental Analysis — looking at a company's balance sheet, earnings, revenues, and what's happening in that company's underlying business. Investors who use Fundamental Analysis to identify good stocks to buy or sell can also benefit from CSGP Technical Analysis to help find a good entry or exit point. Technical Analysis is blind to the fundamentals and looks only at the trading data for CSGP stock — the real life supply and demand for the stock over time — and examines that data in different ways. One of those ways is to calculate a Simpe Moving Average ("SMA") by looking back a certain number of days. One of the most popular "longer look-backs" is the CSGP 200 day moving average ("CSGP 200 DMA"), while one of the most popular "shorter look-backs" is the CSGP 50 day moving average ("CSGP 50 DMA"). A chart showing both of these popular moving averages is shown on this page for CoStar Group.
10 Most Oversold S&P 500 Stocks
10 Most Overbought S&P 500 Stocks

10 ETFs With Stocks Insiders Are Buying
10 ETFs With Most Upside To Targets
The DividendRank Top 25
Warren Buffett Dividend Stocks
10 Cheap Dividend Stocks Under $10
10 Top DividendRank'ed Energy Stocks
The 10 Highest Yielding Preferred Stocks
The 15 Most Active S&P Call & Put Options
Quotes delayed 20 minutes

Email EnvelopeFree CSGP Email Alerts:
Get Dividend Alerts
Get SEC Filing Alerts
Video: Technical Analysis


If the video does not load after a few moments, Upgrade to the Latest Flash Player.
CoStar Group (CSGP) is categorized under the Industrials sector; to help you further research DMA, below are some other companies in the same sector:

CSX DMA
CTAS DMA
DAL DMA
DE DMA
DOV DMA
EBAY DMA
EFX DMA
EMR DMA
ETN DMA
EXPD DMA
More Industrials companies »


CSGP DMA | www.StockDMA.com | Copyright © 2019 - 2023, All Rights Reserved

Nothing in StockDMA.com is intended to be investment advice, nor does it represent the opinion of, counsel from, or recommendations by BNK Invest Inc. or any of its affiliates, subsidiaries or partners. None of the information contained herein constitutes a recommendation that any particular security, portfolio, transaction, or investment strategy is suitable for any specific person. All viewers agree that under no circumstances will BNK Invest, Inc,. its subsidiaries, partners, officers, employees, affiliates, or agents be held liable for any loss or damage caused by your reliance on information obtained. By visiting, using or viewing this site, you agree to the following Full Disclaimer & Terms of Use and Privacy Policy. Video widget and market videos powered by Market News Video. Quote and option data delayed at least 15 minutes; stock quote data powered by Ticker Technologies, and Mergent.
X
Wait! Don't leave yet.
Want to receive our latest research absolutely free?


Click the button below for your complimentary copy of Your Early Retirement Portfolio: Dividends Up to 7.8%—Every Month—Forever.

You'll discover the details on 4 stocks and funds that pay you massive dividends as high as 7.8%.